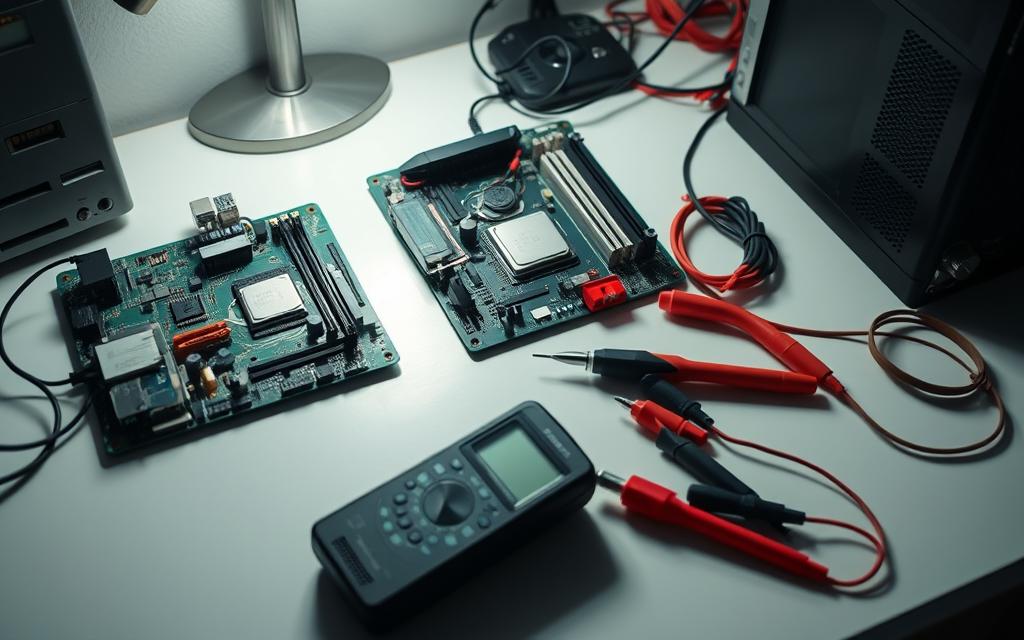
Keeping your system running smoothly starts with recognizing potential hardware failures before they escalate. Overheating, worn-out fans, or failing drives can lead to unexpected crashes and costly repairs.
Common components like GPUs, RAM, and power supplies often show early warning signs. Regular tests using built-in tools or third-party software help catch these issues early.
This guide covers a step-by-step approach to identify and fix problems efficiently. Early detection not only saves money but also extends your system’s lifespan.
Your PC often signals trouble before components fully fail. Paying attention to these cues can save you from sudden crashes or data loss. Early detection improves performance and extends your system’s lifespan.
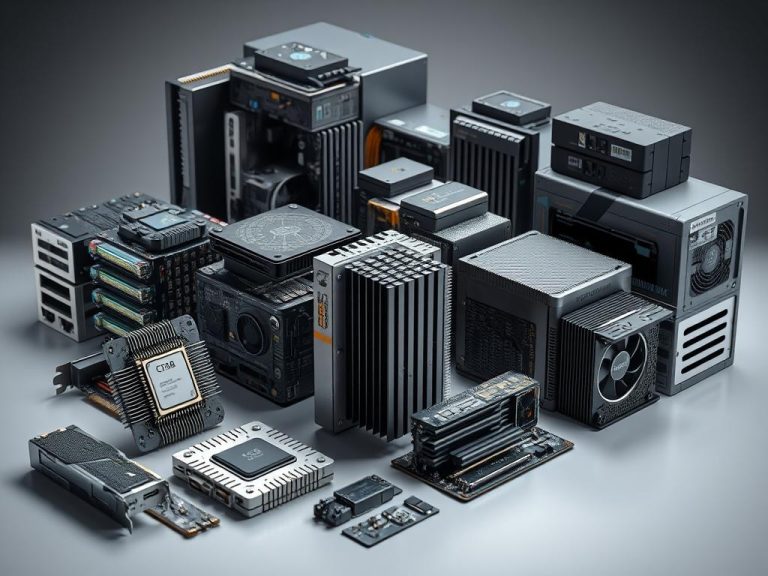
Hardware Components Most Prone to Failure
RAM and storage drives top the list for frequent issues. RAM failures trigger BSODs or corrupted files, while aging hard disks slow down and report SMART errors.
GPUs and power supplies follow closely. Overheating GPUs display artifacts or throttle performance, and faulty PSUs cause random reboots.
Symptoms of Failing Hardware
Listen for clicking noises in HDDs—a sign of mechanical failure. Graphical glitches? Your GPU’s VRAM or core might be struggling.
Unexpected shutdowns often point to PSU problems or CPU overheating. Tech forums highlight intermittent connectivity and slow boots as early red flags.
How to Diagnose Computer Hardware Using Windows Tools
Windows offers built-in utilities to pinpoint system issues before they escalate. These tools analyze hardware health without requiring technical expertise. Early detection prevents crashes and data loss.
Performance Monitor: Holistic System Analysis
Accessible via Administrative Tools, Performance Monitor tracks CPU, disk, and RAM usage in real time. Create custom logs to identify bottlenecks or failing components. For example, consistent disk usage spikes may indicate a failing SSD.
Windows Memory Diagnostic: Testing RAM Stability
Run this tool by typing mdsched.exe in the Start menu (admin privileges required). It reboots your system to perform memory tests using three patterns:
Test Pattern
Purpose
Duration
MATS+
Basic RAM detection
5–10 mins
INVC
Cache validation
15–20 mins
SCHCKR
Advanced error scanning
30+ mins
Results appear in Event Viewer under MemoryDiagnostic. Error codes like 0xC0000005 suggest faulty RAM modules. A case study showed multi-pass testing resolved random freezes caused by marginal memory errors.
Limitations: While useful, this tool lacks GPU or storage diagnostics. For deeper analysis, third-party tools (covered in Section 4) are recommended.
Third-Party Diagnostic Tools for Comprehensive Testing
Built-in utilities have limits. Third-party tools offer deeper insights into your system health. These solutions provide real-time monitoring, detailed reports, and advanced diagnostics for all critical components.
MemTest86+: Advanced RAM Diagnostics
When RAM causes crashes but Windows tools show no errors, MemTest86+ delivers answers. This free tool boots from USB to test memory modules thoroughly.
It runs multiple algorithms to detect subtle errors. Unlike basic tests, it checks every memory address. Results highlight faulty sectors needing replacement.
CrystalDiskInfo: Hard Drive Health Monitoring
Storage drives fail gradually. CrystalDiskInfo tracks wear using SMART technology. It monitors temperature, error rates, and spin-up times.
The color-coded health rating simplifies decisions:
Status
Meaning
Action
Blue
Good
Normal use
Yellow
Caution
Backup data
Red
Bad
Replace immediately
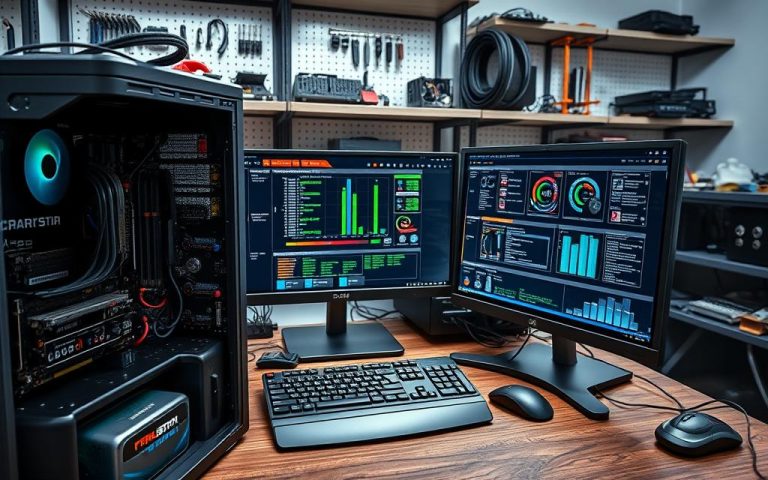
HWiNFO: Real-Time Hardware Analytics
For power users, HWiNFO tracks 500+ sensor parameters. It displays CPU thermals, fan speeds, and voltage fluctuations with precision.
Key features include:
Custom dashboard creation for GPU/CPU metrics
Logging for performance trend analysis
Rainmeter integration for desktop widgets
Compatible from Windows 7 to 11, it’s ideal for troubleshooting intermittent issues.
Checking Your Laptop Battery Health
A fading battery can silently cripple your laptop’s performance. Unlike other hardware, its decline is gradual but impactful. Windows offers built-in tools to assess health before emergencies arise.
A 20%+ gap between these values signals wear. Charge cycles (full 0%–100% drains) also affect lifespan. Modern batteries tolerate 300–500 cycles before significant degradation.
Wear Level
Status
Action
≤10%
Excellent
Monitor monthly
11%–25%
Good
Calibrate quarterly
26%–40%
Fair
Plan replacement
>40%
Poor
Replace immediately
For inaccurate readings, calibrate by draining the battery fully, then charging uninterrupted. Avoid extreme temperatures—heat accelerates chemical wear.
Pro Tip: Keep charge between 20%–80% for longevity. Stores like Best Buy offer free health checks if self-diagnostics feel overwhelming.
Stress Testing Your CPU and GPU
Pushing your system to its limits reveals hidden weaknesses before they cause real trouble. Stress tests simulate extreme workloads to uncover hardware flaws that routine use might miss. This proactive approach prevents crashes during critical tasks.
Tools for CPU Stress Tests
MSI Afterburner and OCCT are top choices for evaluating processor stability. They push CPUs to 100% load while tracking thermals and clock speeds. Watch for thermal throttling—a sign your cooling solution needs upgrades.
Clock consistency: Drops indicate power delivery issues.
Voltage fluctuations: Unstable values suggest motherboard or PSU problems.
Monitoring GPU Performance
GPU-Z provides real-time data on performance, including hotspot temps and memory junction readings. FurMark’s artifact scanning exposes rendering errors caused by failing VRAM.
For crypto mining damage diagnosis:
Run MemTestG80 to validate VRAM integrity.
Check for pixelated textures or screen tearing.
Compare benchmark scores against factory specs.
FurMark’s "Xtreme Burn" mode confirms stability under max load.
Always monitor temperatures during tests. Sudden shutdowns or visual glitches signal immediate termination to avoid permanent issues.
Diagnosing Hardware with Linux Live Environments
Linux live environments provide a powerful way to test components without altering your main system. These bootable USB drives run independently of your OS, ideal for troubleshooting unbootable machines or deep-level diagnostics.
PartedMagic: Paid but Powerful
This premium suite includes 100+ utilities like MHDD for low-level HDD repairs and CPUID for hardware validation. Key features:
Victoria: Fixes bad sectors on aging drives.
BIOS flashing: Updates firmware on legacy motherboards.
GSmartControl: Monitors SMART data for early failure warnings.
Updated annually, it’s a top choice for IT professionals.
Ultimate Boot CD: Free Alternative
UBCD offers comparable tools without cost. Highlights:
MemTest86+: Rigorous RAM testing for crash root causes.
Psensor: Tracks real-time thermals and fan speeds.
GParted: Resizes partitions without data loss.
UBCD’s networking suite diagnoses enterprise environments with ping, traceroute, and packet analysis.
Both options deliver offline diagnostics, but PartedMagic’s advanced features justify its price for power users.
Cleaning and Maintaining Your Hardware
Dust buildup silently degrades performance over time. Left unchecked, it causes overheating and strains critical components. Regular care prevents 80% of common failures while extending your system’s lifespan.
ESD-safe brushes (stiff and soft bristle varieties)
iFixit toolkit with spudgers and tweezers
90% isopropyl alcohol for thermal paste removal
Anti-static wrist strap for component handling
For fans and vents, use compressed air at a 45-degree angle. Hold fan blades stationary to prevent bearing damage. Cotton swabs remove stubborn dust from heatsink fins.
Repasting GPUs/CPUs in 5 Steps:
Remove cooler with even pressure
Wipe old paste with alcohol wipes
Apply pea-sized thermal compound
Reinstall cooler using cross-pattern screws
Verify temperatures under load
Interval
Task
Time Required
Weekly
Exterior wipe-down
5 minutes
Monthly
Fan and vent cleaning
15 minutes
Quarterly
Full internal dusting
30 minutes
Biannually
Thermal paste replacement
45 minutes
Case Study: A gaming laptop showed 12°C lower GPU temps after thorough cleaning. Its fans no longer ramped to maximum speed during moderate loads. This improved frame consistency by 18% in benchmark tests.
Store systems in well-ventilated areas with 3+ inches of clearance. Cable management enhances airflow—use Velcro straps for neat routing. Monitor temperatures monthly with HWMonitor to catch issues early.
For stubborn grime on components, use microfiber cloths lightly dampened with distilled water. Never spray liquids directly onto hardware. These practices keep systems running cooler and quieter for years.
Updating Drivers and Firmware for Optimal Performance
Outdated drivers and firmware often cause performance bottlenecks and security vulnerabilities. Regular updates ensure compatibility, stability, and access to new features. Neglecting them risks crashes, reduced efficiency, or even malware exploits.
Major brands like Dell, HP, and ASUS provide utilities for safe BIOS updates. Follow these general steps:
Download the correct BIOS file from the manufacturer’s support page.
Back up critical data and close all applications.
Run the installer or use a USB drive for UEFI updates.
Note: Never interrupt a BIOS flash—it can brick your system.
WHQL-Certified Drivers: Stability Over Latest Versions
Windows Hardware Quality Labs (WHQL) tests drivers for compatibility. Certified versions may lag behind beta releases but avoid instability. Check certification via Device Manager’s “Digital Signer” field.
Driver Type
Pros
Cons
WHQL-Stable
Tested, fewer crashes
May lack newest features
Beta
Early access to optimizations
Potential bugs, no support
Firmware Updates for SSDs and Peripherals
SSDs benefit from firmware patches addressing wear-leveling or speed issues. Use tools like Samsung Magician or Crucial Storage Executive. For peripherals (e.g., mice, keyboards), manufacturer software handles updates.
Automated Tools: Snappy vs. OEM Utilities
Snappy Driver Installer: Offline database for bulk updates, but lacks vendor validation.
OEM Tools: Dell Command Update or HP Support Assistant offer safer, tailored updates.
Third-party tools risk bundling bloatware—stick to trusted sources.
Conclusion
Proactive care keeps your system running at peak performance. Regular tests and timely maintenance prevent costly repairs and downtime.
Home users benefit from simple routines like dusting and driver updates. Enterprises should invest in professional monitoring for critical components. Both approaches minimize hardware issues before they escalate.
For a detailed troubleshooting guide, explore our step-by-step walkthrough. Start today—schedule monthly checkups to extend your system’s lifespan.
FAQ
What are the most common hardware failures in a PC?
Hard drives, RAM modules, and power supplies are the most prone to failure. Overheating, frequent crashes, and slow performance often signal these issues.
How can I check my RAM for errors using Windows?
Use Windows Memory Diagnostic. Press Win + R, type mdsched.exe, and restart your system to run the test.
Which third-party tool is best for hard drive health checks?
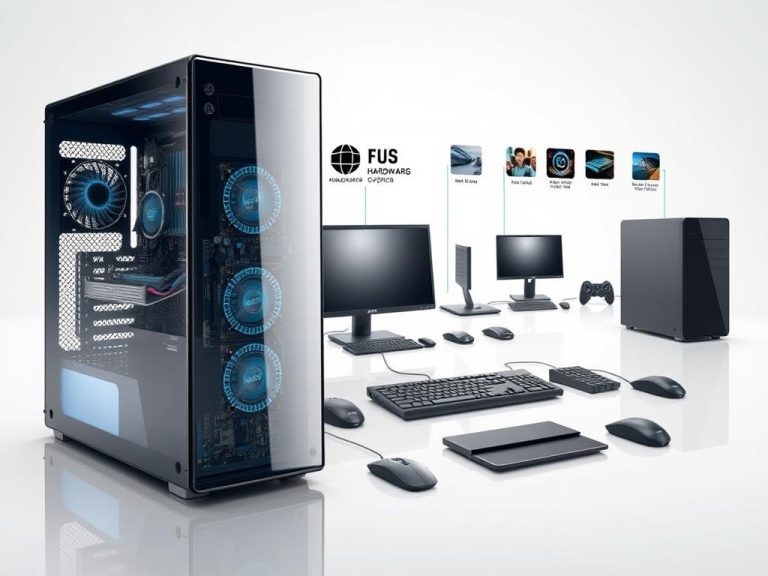
Computer hardware refers to the physical parts of computing devices. These components turn digital instructions into working computer functions1. Hardware includes all physical elements that make a computer system work. It has changed a lot since the first computers1. We’ve seen huge mainframes shrink into small personal computers2. Digital computers use complex physical parts to…
Keeping your system running smoothly requires regular checks. Hardware diagnostics help spot issues before they cause major problems. Components like GPUs, SSDs, and RAM often fail over time. Proactive tests save money by avoiding costly repairs. Slow performance or sudden crashes signal potential failures. Built-in Windows tools and third-party software simplify diagnostics. This guide covers…
Understanding computer hardware specs is vital for tech-savvy users. These insights reveal your system’s capabilities and potential upgrades. Windows 10 and 11 offer simple ways to explore your computer’s components12. Hardware specs provide a snapshot of your system’s key technical details. They show processor type, speed, memory, and graphics capabilities. This information is crucial for…
Digital data storage is vital for computers to keep and manage information. Computer memory has evolved significantly since its early days. It has grown from basic storage methods to advanced non-volatile solutions1. To grasp long-term data storage, we must explore various memory technologies. Modern computers use different hardware parts to store information. These range from…
Understanding your computer specs is essential for smooth performance. These specs include critical components like the CPU, RAM, and storage. Without proper system details, running demanding apps can lead to crashes or slowdowns. Outdated drivers often cause inefficiencies. Tools like Avast Driver Updater help automate driver updates, ensuring peak hardware performance. This guide provides easy…
It’s key to know your computer’s hardware specs for fixing problems, upgrading, and comparing it with others. You can use built-in tools or third-party software to see your computer’s hardware information. The steps vary based on your operating system. For example, Windows 11 users can find their device specs by clicking the Windows Start icon,…